Welcome to our beginner's guide on demystifying quantitative data analysis. In the world of data science, quantitative data analysis plays a crucial role in uncovering valuable insights from numerical data. Whether you are a student, researcher, or professional looking to enhance your data analysis skills, understanding the basics of quantitative data analysis is essential. This guide aims to simplify the complex process of analyzing quantitative data and provide you with a solid foundation to start your journey in data analysis.
The Basics of Quantitative Data Analysis
What is Quantitative Data?
- Quantitative data consists of numerical information or data that can be measured and expressed using numbers.
- Examples of quantitative data include height, weight, age, temperature, income, and test scores.
- Quantitative data can be analyzed using statistical methods to identify patterns, trends, and relationships within the data.
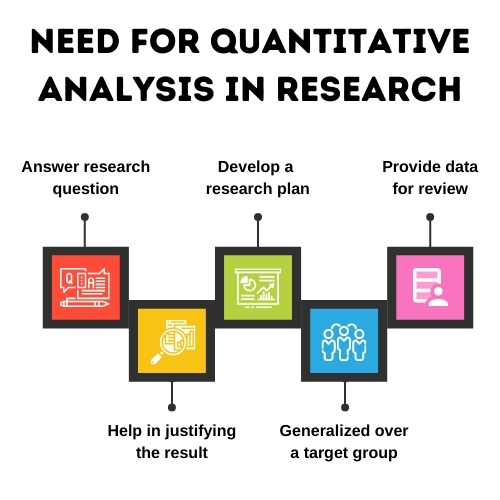
Why is Quantitative Data Analysis Important?
- Quantitative data analysis helps in making informed decisions based on evidence and facts.
- It provides a systematic approach to analyzing data and drawing valid conclusions.
- Quantitative data analysis is used in various fields such as business, healthcare, social sciences, and research.
Steps in Quantitative Data Analysis
1. Data Collection
- Collect relevant quantitative data from reliable sources such as surveys, experiments, databases, or observations.
- Ensure that the data is accurate, complete, and representative of the population or sample being studied.
2. Data Cleaning and Preprocessing
- Check for missing values, outliers, and errors in the data that may affect the analysis.
- Transform and standardize the data to ensure consistency and compatibility for analysis.
3. Descriptive Statistics
- Summarize the main characteristics of the data using measures such as mean, median, mode, standard deviation, and range.
- Visualize the data through graphs, charts, and histograms to explore patterns and distributions.
4. Inferential Statistics
- Use statistical tests such as t-tests, ANOVA, regression analysis, and correlation to infer relationships and make predictions based on the data.
- Determine the significance of results and draw conclusions based on the statistical analysis.
Common Tools for Quantitative Data Analysis
1. Microsoft Excel
- Excel is a widely used spreadsheet software that offers various functions for data analysis, visualization, and reporting.
- It is suitable for basic statistical analysis and creating simple charts and graphs.
2. SPSS (Statistical Package for the Social Sciences)
- SPSS is a statistical software package used for complex data analysis, hypothesis testing, and data management.
- It provides a user-friendly interface and a wide range of statistical tools for researchers and data analysts.
3. R Programming
- R is a programming language and software environment specifically designed for statistical computing and graphics.
- It is open-source and highly customizable, making it suitable for advanced statistical analysis and data visualization.
Challenges in Quantitative Data Analysis
1. Data Quality
- Poor data quality, including missing values, errors, and inconsistencies, can lead to inaccurate analysis and unreliable results.
- It is essential to ensure data integrity and quality throughout the data analysis process.
2. Interpretation of Results
- Understanding and interpreting statistical results can be challenging for beginners, especially when dealing with complex analyses.
- Seeking guidance from experts or referring to textbooks and online resources can help clarify the interpretation of results.
Conclusion
Quantitative data analysis may seem intimidating at first, but with the right knowledge and tools, you can effectively analyze numerical data to extract meaningful insights. By following the steps outlined in this beginner's guide and familiarizing yourself with common statistical tools, you will be well-equipped to tackle quantitative data analysis with confidence. Remember, practice makes perfect, so don't hesitate to apply your new skills to real-world data analysis tasks to enhance your proficiency over time.